Crime in my Area
Crime rates by city
Stay updated. Stay safe. Check the latest crime rates in your local city.


We're local to you
Crime can be found in every corner of the country, fortunately we can too. We have thousands of branches and installers nationwide. So no matter where you are you'll be able to find ADT experts to keep your home safe.
We safeguard over 237,000 UK properties and more than 2,000 new customers each month put their faith in us.
XXXXX
- Branches:
- Installations:

How do video doorbell cameras work?
Gone are the days when you have to sneak to the door to check who's knocking. With a video doorbell camera, you can answer from anywhere; even if you’re miles away from your property. Learn the benefits of a video doorbell and how they work in our expert guide.

8 signs that your house is marked for burglary
Concerned that your home has been marked for burglary? Identify the signs and what to do if you're right, with advice from the security experts at ADT.
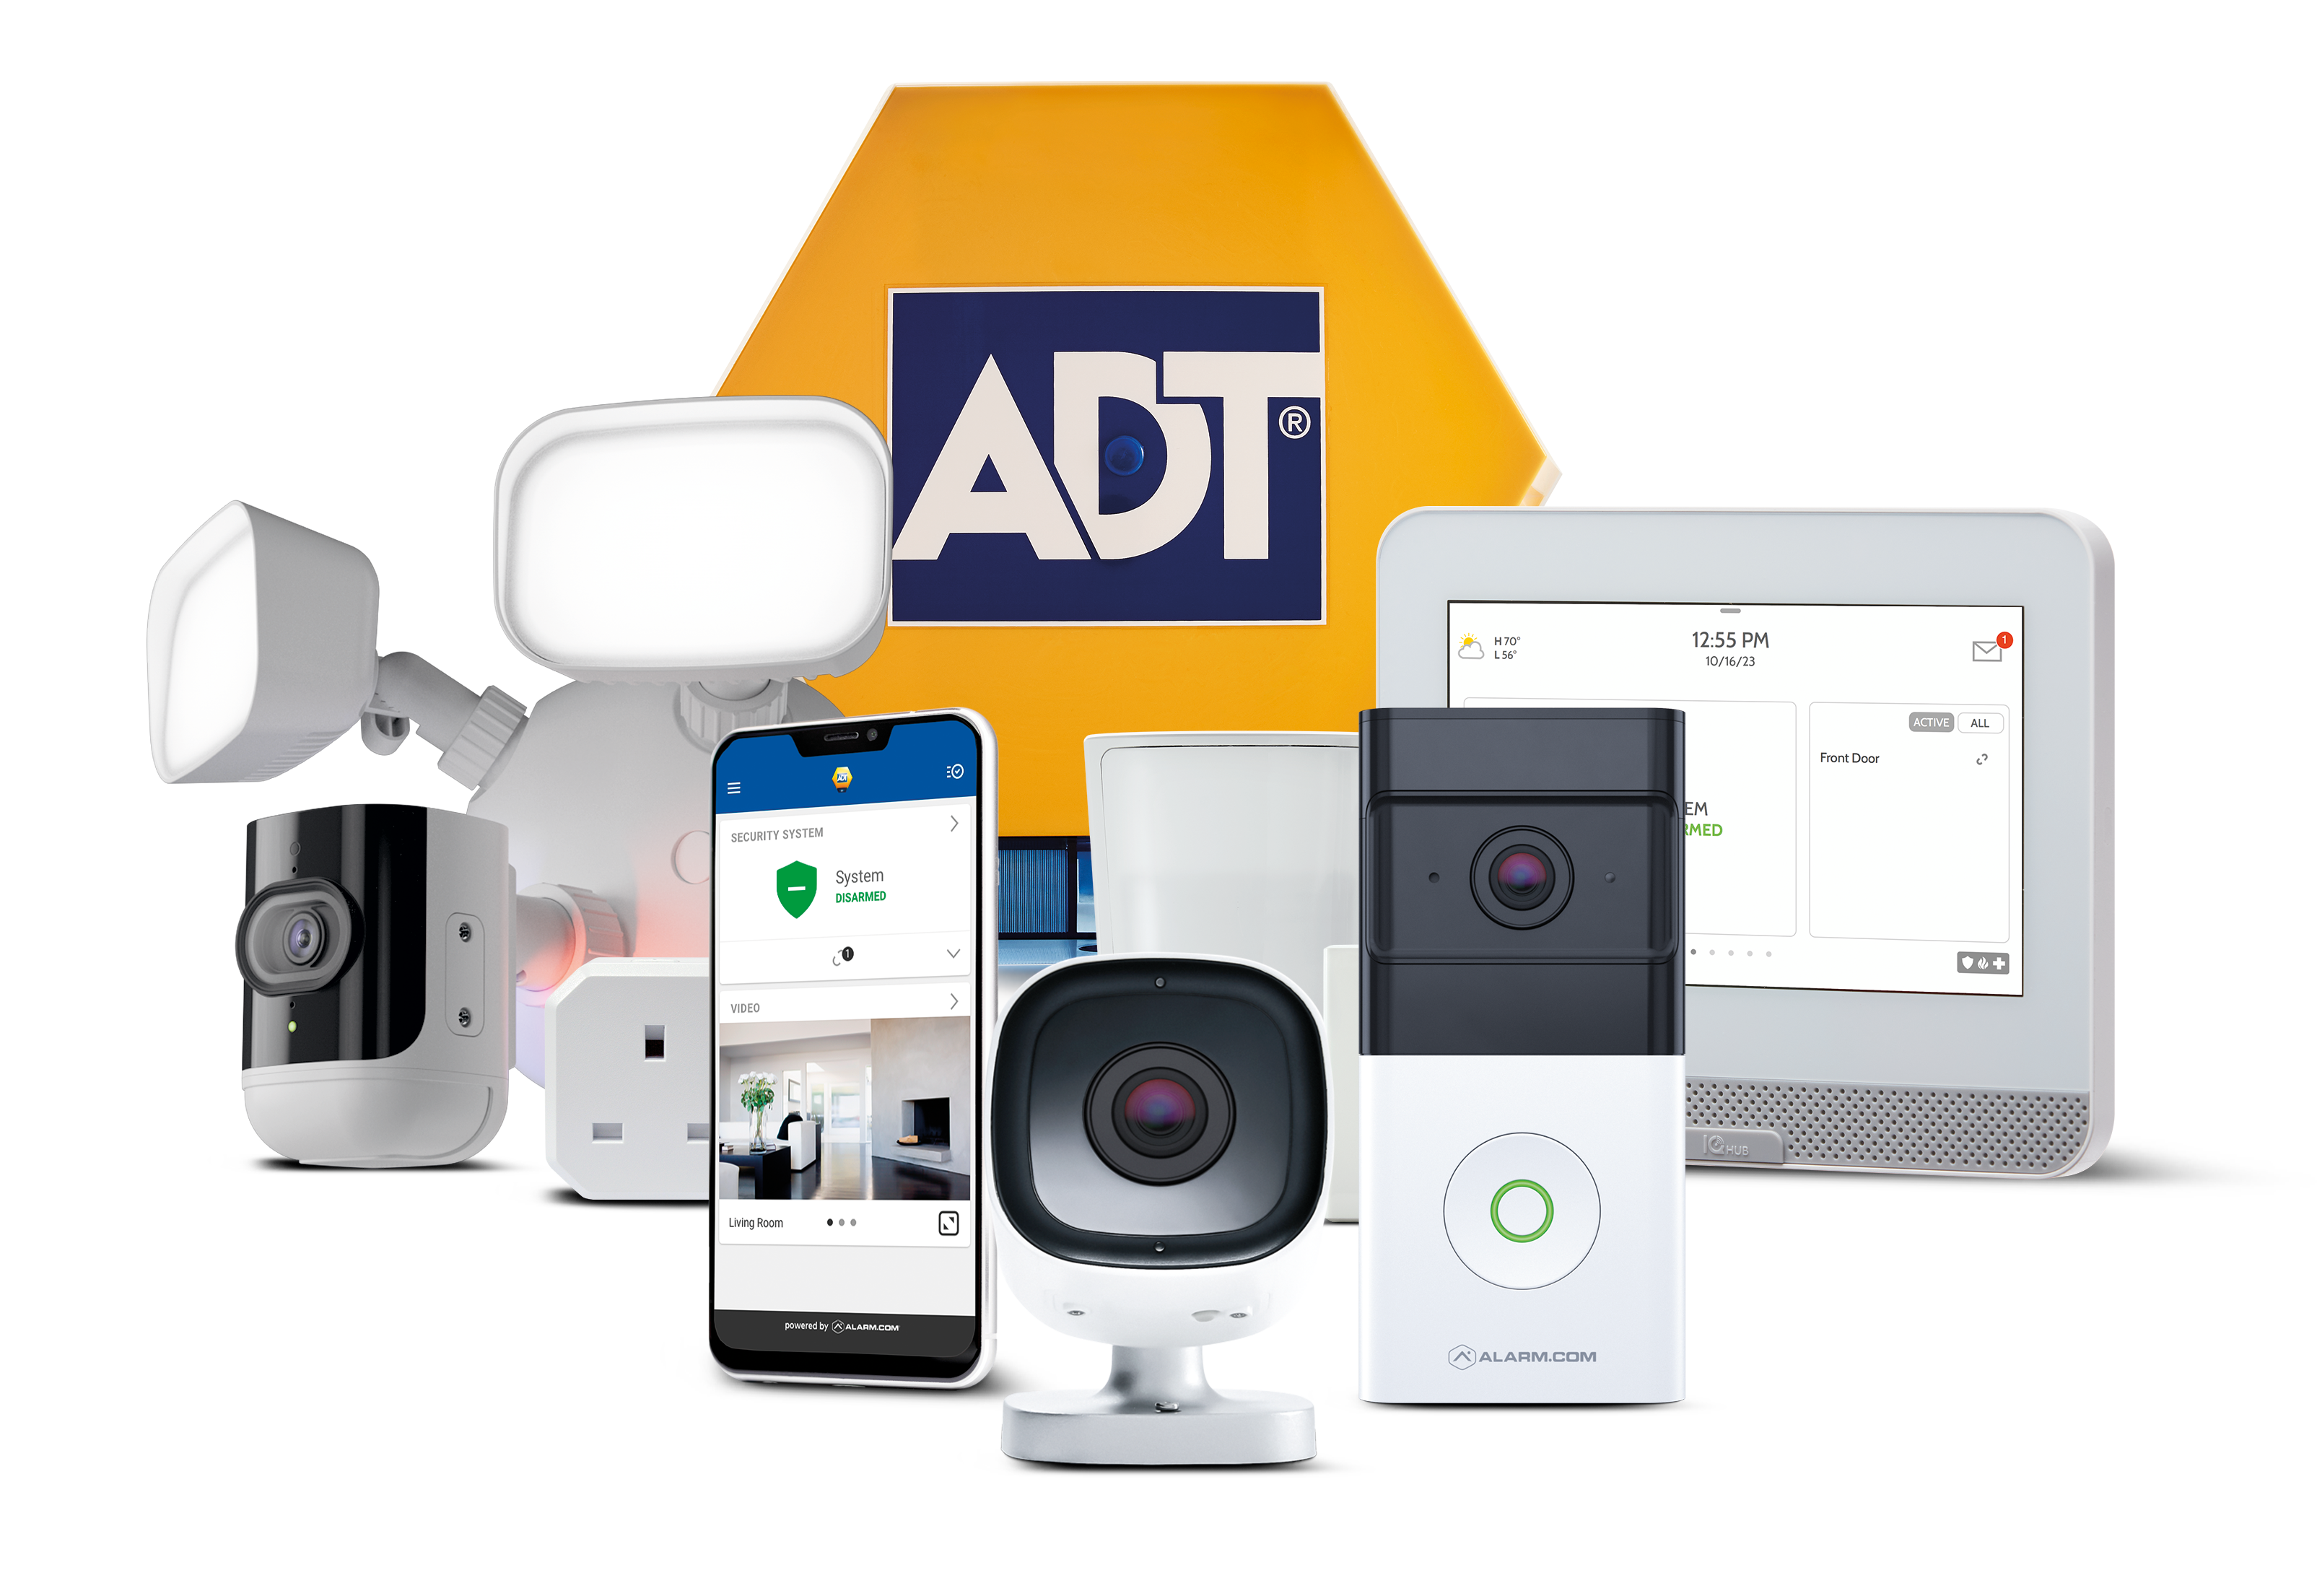
Making security work for you
Off the peg is fine for suits, less so for security. At ADT we tailor our security solutions to the way you live your life.

Indoor and outdoor cameras

Video doorbell

Customised smart security

24/7/365 monitoring
Combined with next-gen features, including pet-friendly technology that reduces false alarms and private security response that sends a security professional to your home when your alarm’s activated, it’s the perfect way to personalise peace of mind.
Learn moreMoving Home?
Visit our Moving Home section for help to make your new home secure and transfer your current contract effortlessly
Moving homeTrustpilot
From our all-inclusive service and 24-hour support to our quality bespoke alarm systems and professional engineers, we're the industry-leading experts you can trust.
Trusted by over 240,000 customers and have an average TP rating of over 4.5*
Tips on home security
Our blog features articles to help keep you and your home secure, wherever you live.

Moving House Guide
Moving house can be one of life's most exciting events, but also one of the more stressful. We have a few ideas to help make the process a little simpler for the whole family.
Homebuyers Security Checklist
Whether you're starting your search or about to move in, this handy checklist will help you identify security priorities.