Safest Streets: The UK’s Safest Postcodes
July 20 2023
Share


It’s no secret that crime levels vary from region to region, city to city and even from street to street. As such, where you live can have immense implications for your safety and the safety of your home too.
There are, however, precautions that you can take to protect yourself and your home better. For instance, you can install a smart home security system with doorbell cameras and security alarms.
To find out where the safest cities and streets in the UK are, our experts at ADT have researched UK crime figures. We looked at police force numbers, fire incidents, the number of CCTV cameras, as well as crime rates and burglary rates, the latter of which we also looked at on a postcode sector level.
If you’d like to check out how safe your local is, you can use our crime in my area tool.
UK postcode sectors with the lowest crime rates
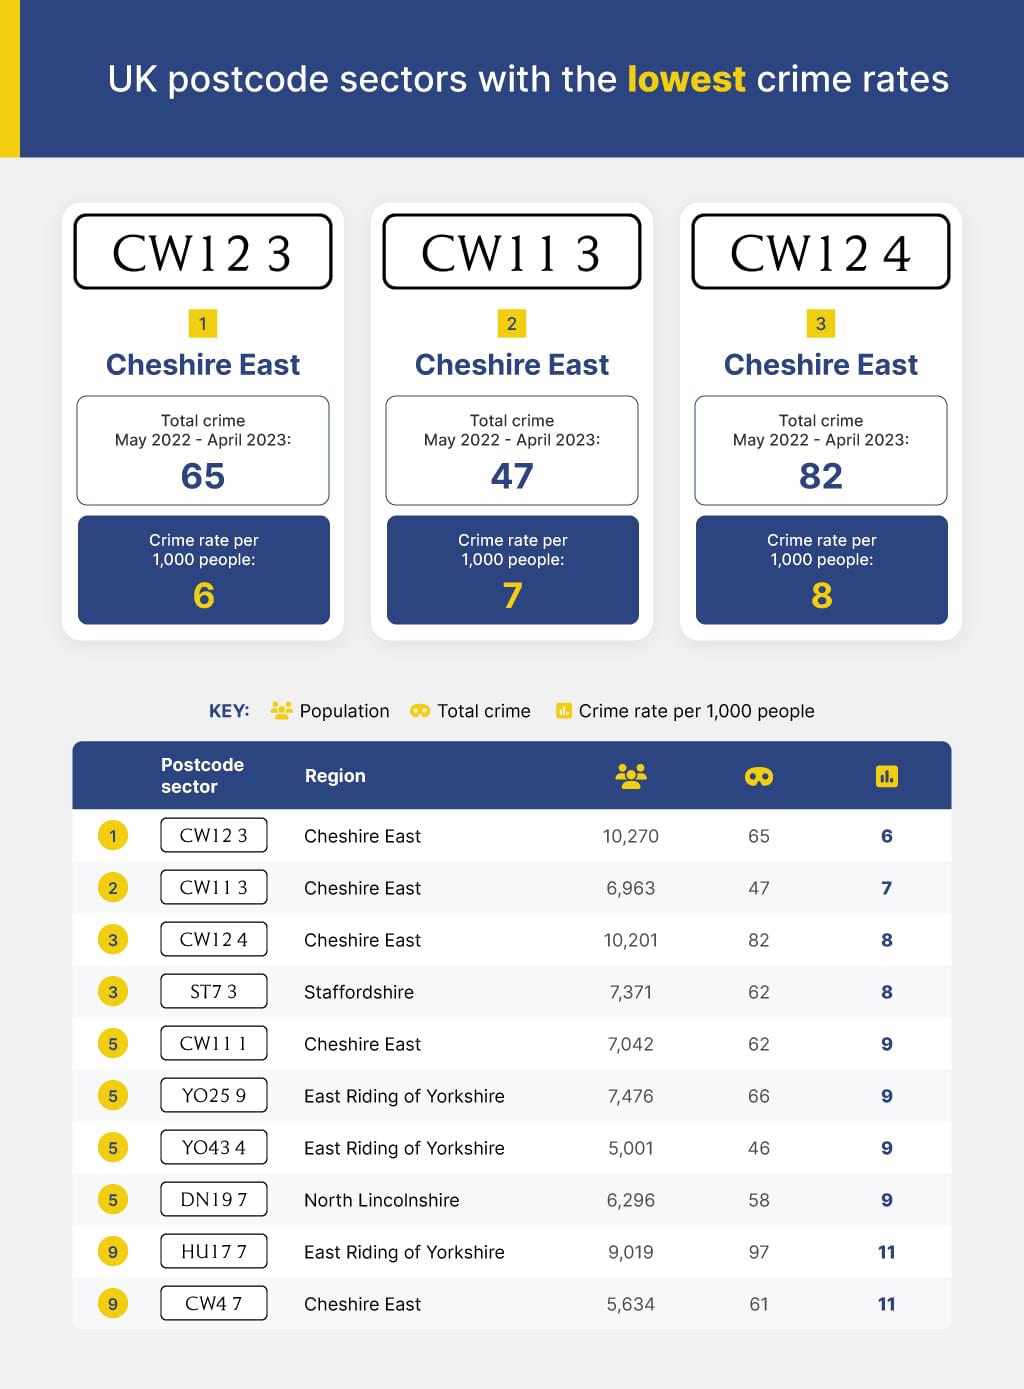
1. Postcode: CW12 3 | Region: Cheshire East
Total Crime May 2022 - April 2023: 65 | Crime Rate per 1,000 People: 6
The postcode sector with the lowest crime rate in the UK is CW12 3, which is in East Cheshire and covers areas such as Congleton and Rushton. The population of this area is 10,270 and the crime rate is 6 per 1,000 people. More than 90% of these crimes were non-violent, with the vast majority being anti-social behaviour.
2. Postcode: CW11 3 | Region: Cheshire East
Total Crime May 2022 - April 2023: 47 | Crime Rate per 1,000 People: 7
The next postcode area is also in East Cheshire, CW11 3, which encompasses the wards of Warmingham, Moston and Sandbach. The crime rate for this postcode area is 7 per 1,000 people, additionally, this postcode had no violent crimes. All of the crimes in this postcode sector were for anti-social behaviour.
3. Postcode: CW12 4 | Region: Cheshire East
Total Crime May 2022 - April 2023: 82 | Crime Rate per 1,000 People: 8
And the postcode with the third lowest crime rate in the UK is also from East Cheshire, covering the wards of Brereton, Newbold and Somerford. The crime rate is slightly higher here, at 8 per 1,000 people, which with a population of over 10,000 is quite low. Again, none of the crimes for this postcode area were violent crimes, instead the bulk is made up of instances of anti-social behaviour.
Areas in the UK with the lowest crime rate
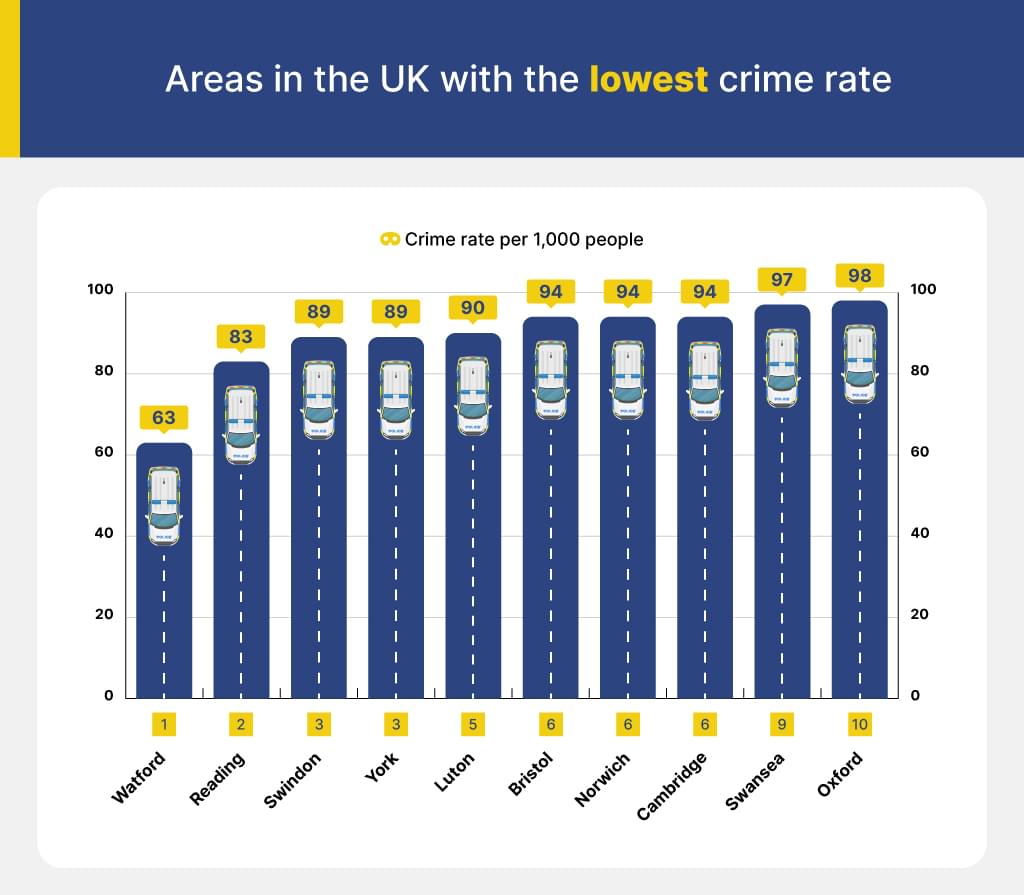
1. Watford
Total Recorded Crimes (Year ending Dec 2022): 8,825 | Crime Rate per 1,000 People: 63
Watford, located in Hertfordshire and just 15 miles northwest of Central London, is the area in the UK with the lowest crime rate. For the year ending December 2022, the area's crime rate was 63 per 1,000 people.
2. Reading
Total Recorded Crimes (Year ending Dec 2022): 19,068 | Crime Rate per 1,000 People: 83
The second lowest crime rate area in the UK is Reading, a large town located on the banks of the Thames and Kennet rivers in Berkshire. Their crime rate for the year ending December 2022 was 83 crimes per 1,000 of their population.
3. Swindon
Total Recorded Crimes (Year ending Dec 2022): 16,950 | Crime Rate per 1,000 People: 89
Swindon, which is located in the southwest of England, has the third lowest crime rate. Per 1,000 of their population, there were 89 crimes committed for the year ending December 2022.
UK postcode sectors with the highest crime rates
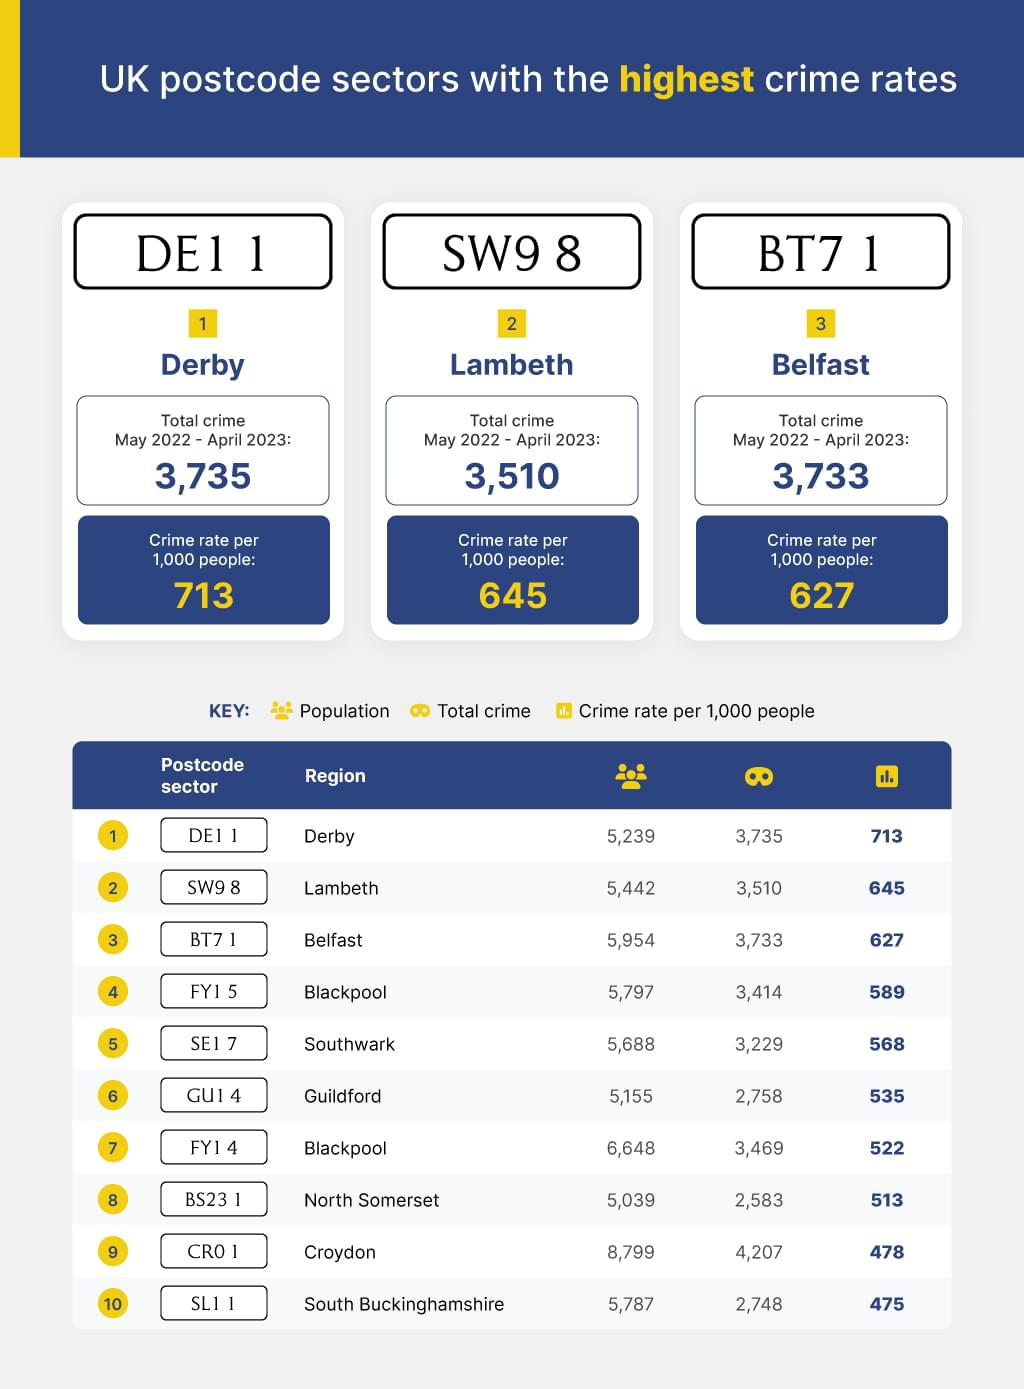
1. Postcode: DE1 1 | Region: Derby
Total Crime May 2022 - April 2023: 3735 | Crime Rate per 1,000 People: 713
The postcode with the highest crime rate in the UK is DE1 1, which is in Derby and covers the wards of Abbey, Arboretum, Darley and Mackworth. This postcode sector has a crime rate of 713 per 1,000 people. Of these crimes, however, more than 60% were classified as non-violent crimes and only 8% of them were burglary crimes.
2. Postcode: SW9 8 | Region: Lambeth
Total Crime May 2022 - April 2023: 3510 | Crime Rate per 1,000 People: 645
SW9 8 is the postcode sector with the second highest crime rate, which is in the London borough of Lambeth. This postcode has a population of just under 5,500 and a crime rate of 645 per 1,000 people. Meaning, there are more than half the amount of crimes committed to every 1,000 people in this part of the London borough. However, on a positive note, more than 80% of these crimes were non-violent.
3. Postcode: BT7 1 | Region: Belfast
Total Crime May 2022 - April 2023: 3733 | Crime Rate per 1,000 People: 627
The postcode with the third-highest crime rate is BT7 1, in Belfast, the second capital city to feature in the top three. This postcode sector has a population of just under 6,000 and covers the southern region of the city. The crime rate for this postcode is 627 per 1,000 people and 73% of the crimes for this postcode were non-violent, the majority of crimes were anti-social behaviour.
The least burgled postcodes in the UK
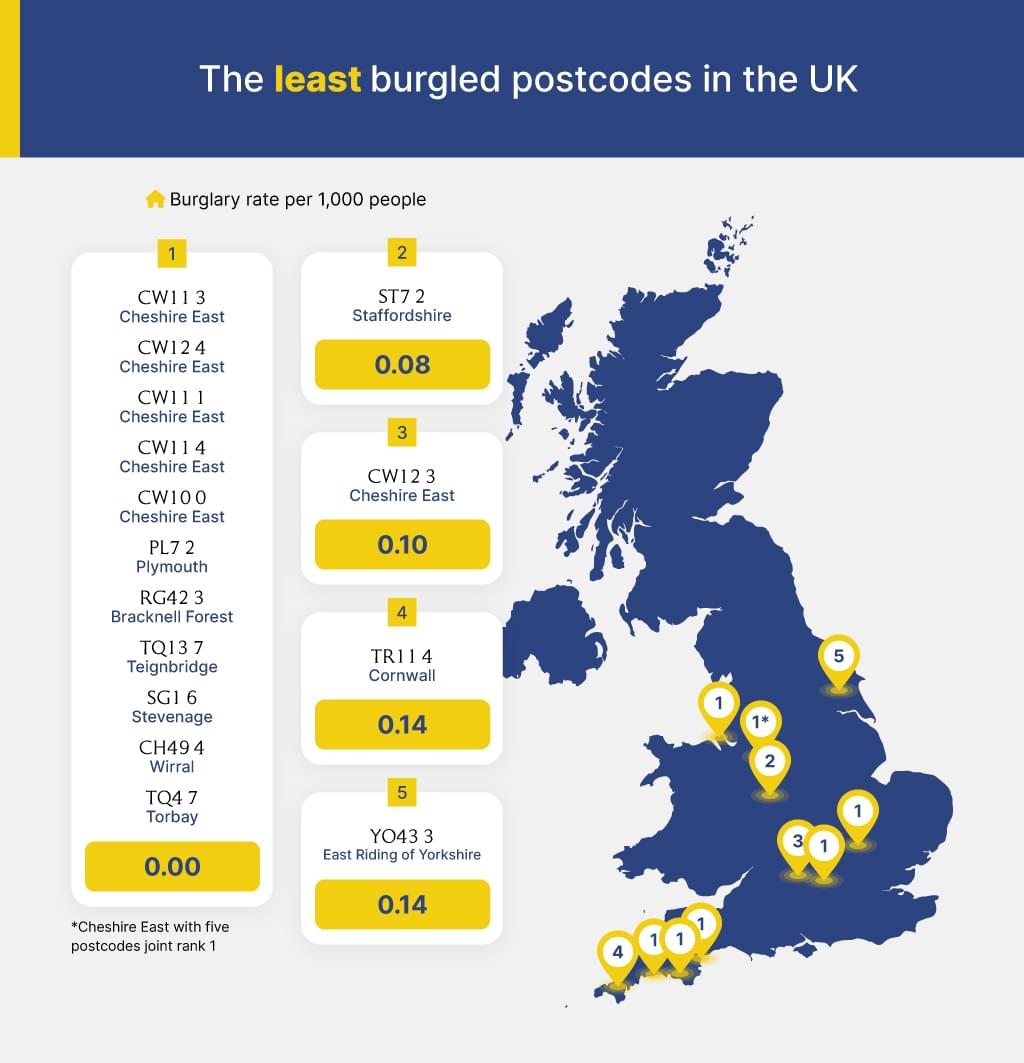
1. Postcode: CW11 3 | Region: Cheshire East
Postcode: CW12 4 | Region: Cheshire East
Postcode: CW11 1 | Region: Cheshire East
Postcode: CW11 4 | Region: Cheshire East
Postcode: CW10 0 | Region: Cheshire East
Postcode: PL7 2 | Region: Plymouth
Postcode: RG42 3 | Region: Bracknell Forest
Postcode: TQ13 7 | Region: Teignbridge
Postcode: SG1 6 | Region: Stevenage
Postcode: CH49 4 | Region: Wirral
Postcode: TQ4 7 | Region: Torbay
Total Burglaries May 2022 - April 2023: 0 | Burglary Rate per 1,000 People: 0
These eleven postcode areas all tie for the least burgled areas in the UK, with every single one of them having a burglary rate of zero over the last 12 months. Five of these postcode areas are in East Cheshire, which is astounding. Plymouth, Bracknell Forest and Stevenage also feature with no burglaries.
2. Postcode: ST7 2 | Region: Staffordshire
Total Burglaries May 2022 - April 2023: 1 | Burglary Rate per 1,000 People: 0.08
ST7 2 in Staffordshire is the postcode that is burgled the second least, with a burglary rate of 0.08 per 1,000 people and a population of almost 12,000. This postcode covers the wards of Alsager, Haslington and Kidsgrove.
3. Postcode: CW12 3 | Region: Cheshire East
Total Burglaries May 2022 - April 2023: 1 | Burglary Rate per 1,000 People: 0.1
Once again, East Cheshire features, with the third lowest burglary rate for their postcode; CW12 3. This postcode sector covers the wards of Congleton, Newbold and Rushton, and per 1,000 people there are 0.1 burglaries.
The least burgled areas in the UK
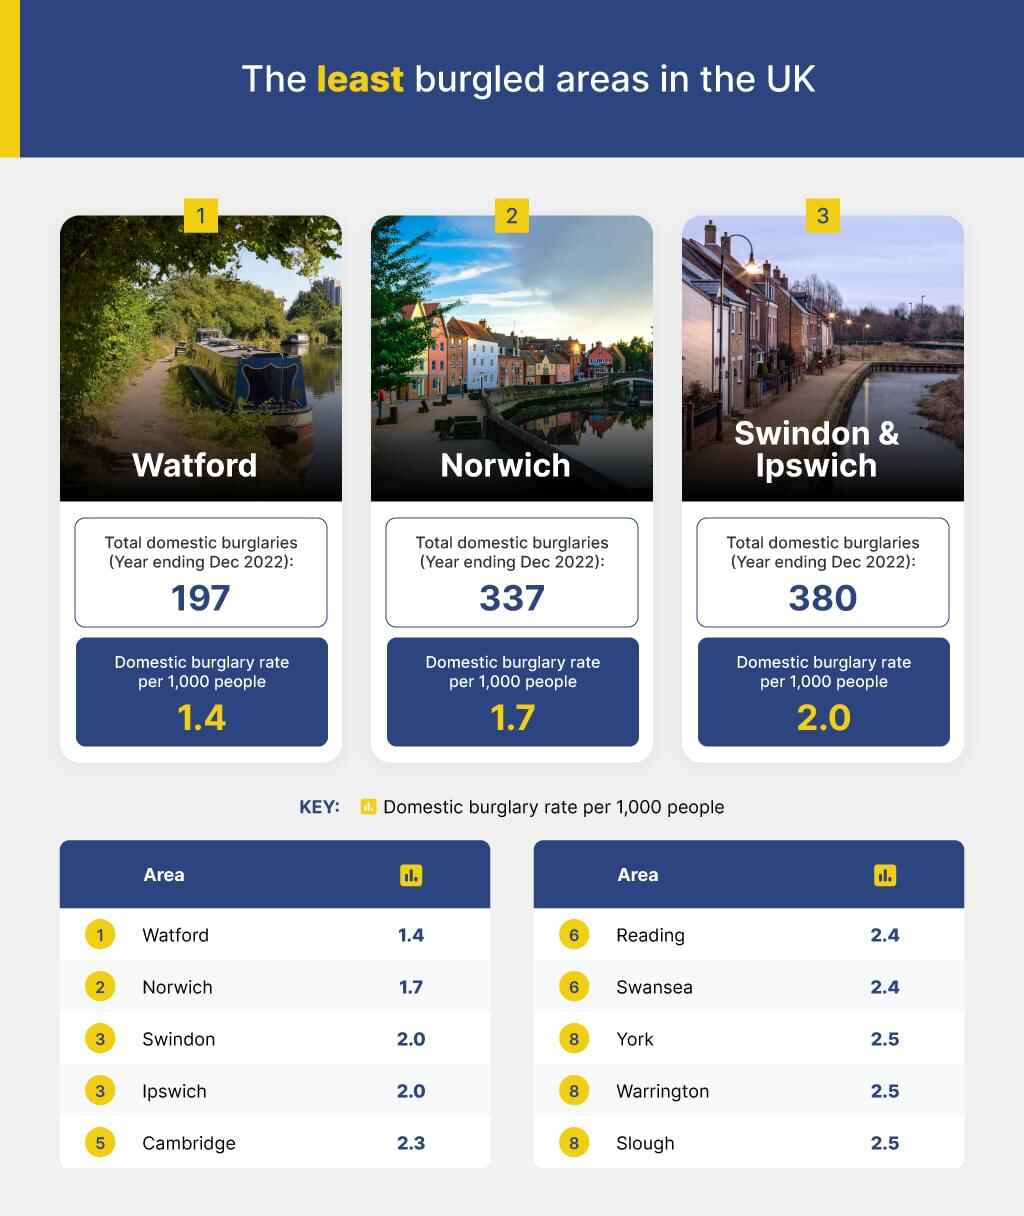
1. Watford
Total Domestic Burglaries (Year ending Dec 2022): 197 | Domestic Burglary Rate per 1,000 People: 1.4
Watford, already having the lowest crime in the UK, also has the lowest burglary rate for the year ending December 2022. During this period, per 1,000 people there were 1.4 burglaries.
2. Norwich
Total Domestic Burglaries (Year ending Dec 2022): 337 | Domestic Burglary Rate per 1,000 People: 1.7
Norwich, a city located in the county of Norfolk in the East of England, is the second least burgled area in the UK. For the year ending December 2022, there were just 1.7 burglaries per 1,000 of the city’s population.
3. Swindon
Total Domestic Burglaries (Year ending Dec 2022): 380 | Domestic Burglary Rate per 1,000 People: 2
Swindon, also already having come out as one of the areas with the lowest crime rates, also has the third-lowest burglary rate in the UK for the year ending December 2022. During this period, there were just 2 burglaries committed per 1,000 of the area's population.
The most burgled postcodes in the UK
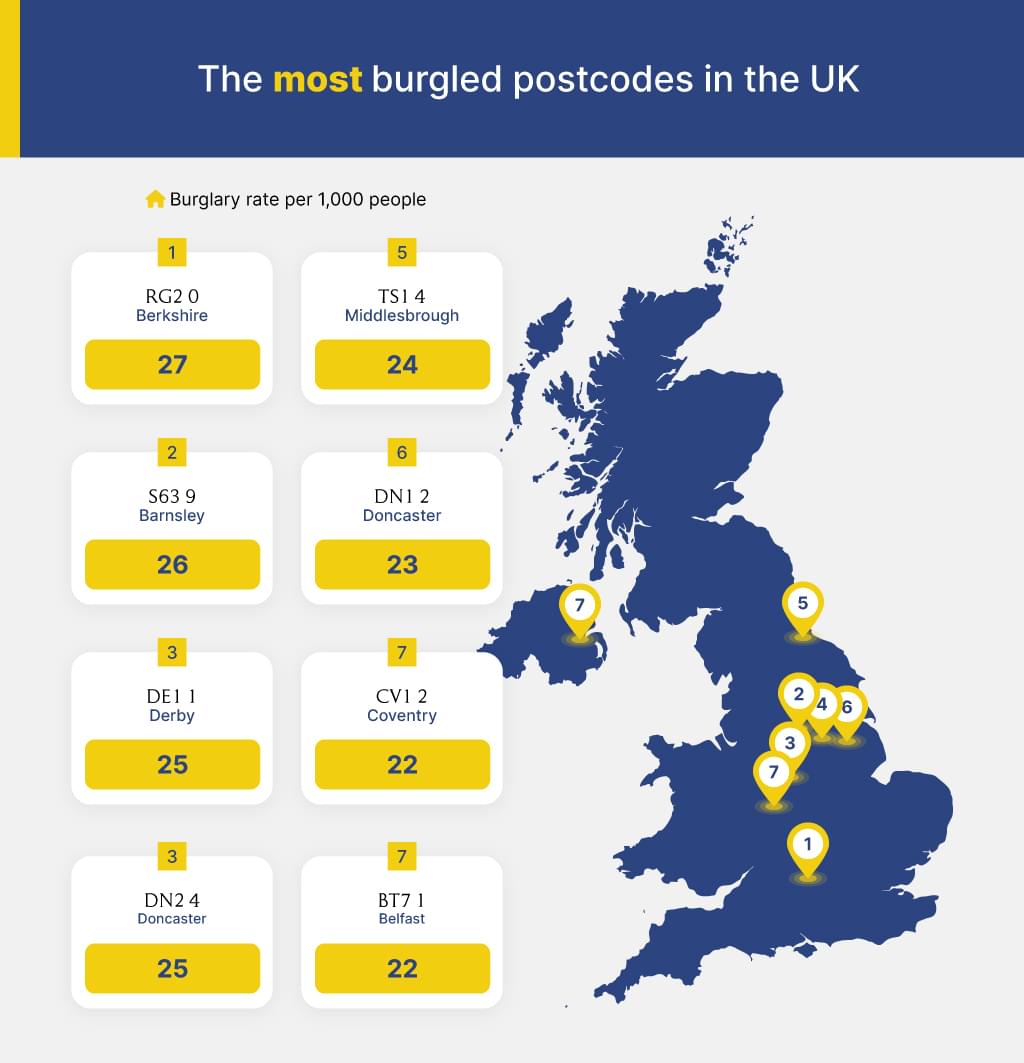
1. Postcode: RG2 0 | Region: Berkshire
Total Burglaries May 2022 - April 2023: 155 | Burglary Rate per 1,000 People: 27
The most burgled postcode in the UK is RG2 0, which is located in Berkshire and covers the wards of Abbey, Katesgrove, and Whitley. Per 1,000 of their 5,727 population, there were around 27 burglaries over the 12 months we looked at.
2. Postcode: S63 9 | Region: Barnsley
Total Burglaries May 2022 - April 2023: 165 | Burglary Rate per 1,000 People: 26
Barnsley’s postcode of S63 9 is the second most burgled, with the area covering the wards of Dearne North and South, as well as Wath. The area has a population of 6,333 and per 1,000 people, there were 26 burglaries during the 12-month period we researched.
3. Postcode: DE1 1 | Region: Derby
Total Burglaries May 2022 - April 2023: 131 | Burglary Rate per 1,000 People: 25
The third most burgled postcode in the UK is DE1 1, which is located in Derby and covers the wards of Darley, Mackworth and Abbey. Their burglary rate over the 12 months we looked at was 25 per 1,000 of the population.
UK areas with the highest police force numbers
In these next two sections, we have looked at the number of police force staff for each city, calculated per 1,000 of the population for each town and city. In theory, studies have indicated that where police force numbers are higher, crime was much more likely to be lower.
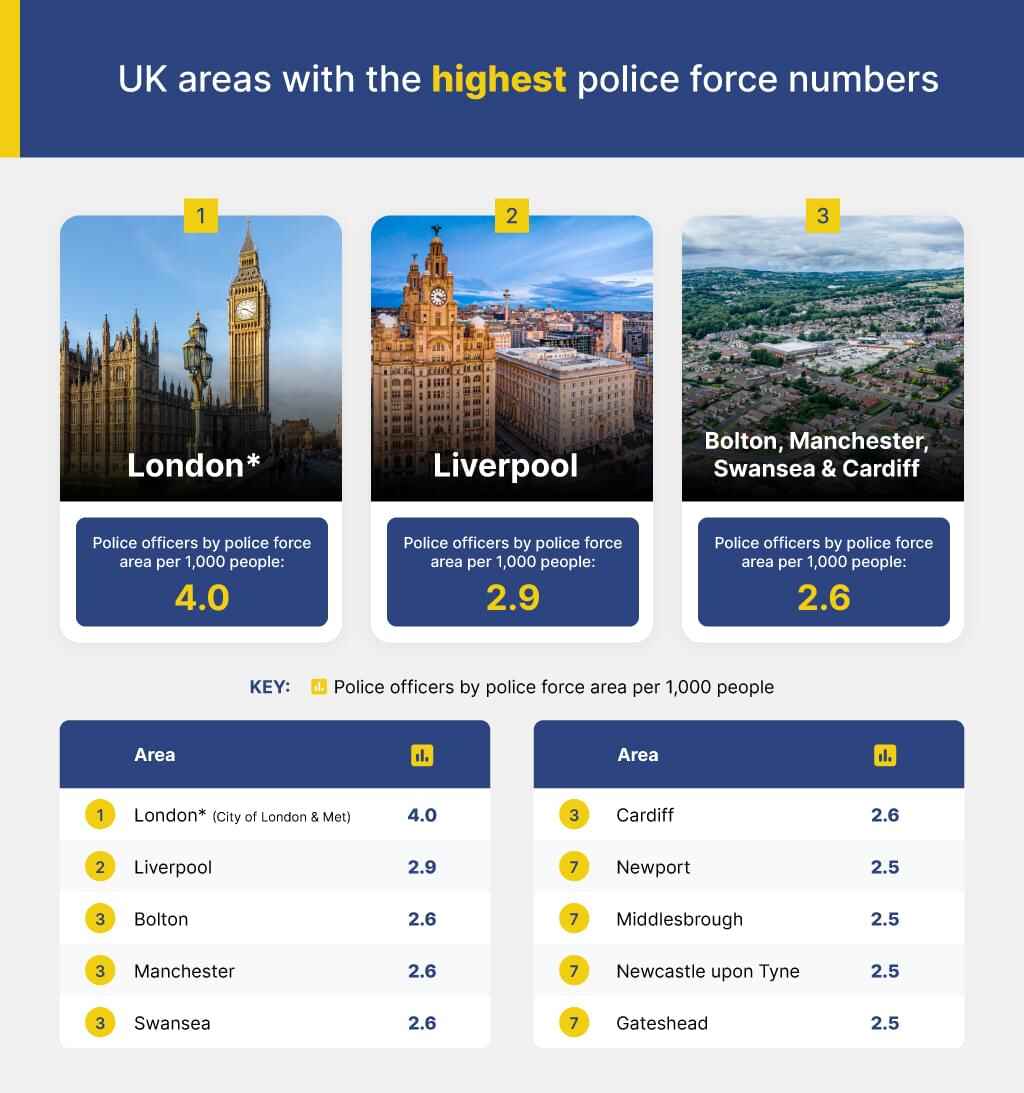
1. London
Police officers per 1,000 people by police force area: 4.0
Unsurprisingly, London has the largest police force presence of all the UK areas we looked at. The police force areas of the Metropolitan Police and City of London have 4 police officers for every 1,000 of the population.
2. Liverpool
Police officers per 1,000 people by police force area: 2.9
Liverpool, which is patrolled by Merseyside Police, has 2.9 police officers for every 1,000 of the police force area’s population. It seems the strong police presence in the city has an impact on burglary rates, with none of the most burgled postcodes being within the city.
3. Bolton | Manchester | Swansea | Cardiff
Police officers per 1,000 people by police force area: 2.6
Bolton and Manchester, served by Greater Manchester Police, and Swansea and Cardiff, patrolled by South Wales Police, come in joint third place, among the largest police presences of all UK areas. There are 2.6 police officers per 1,000 people.
UK areas with the lowest police force numbers
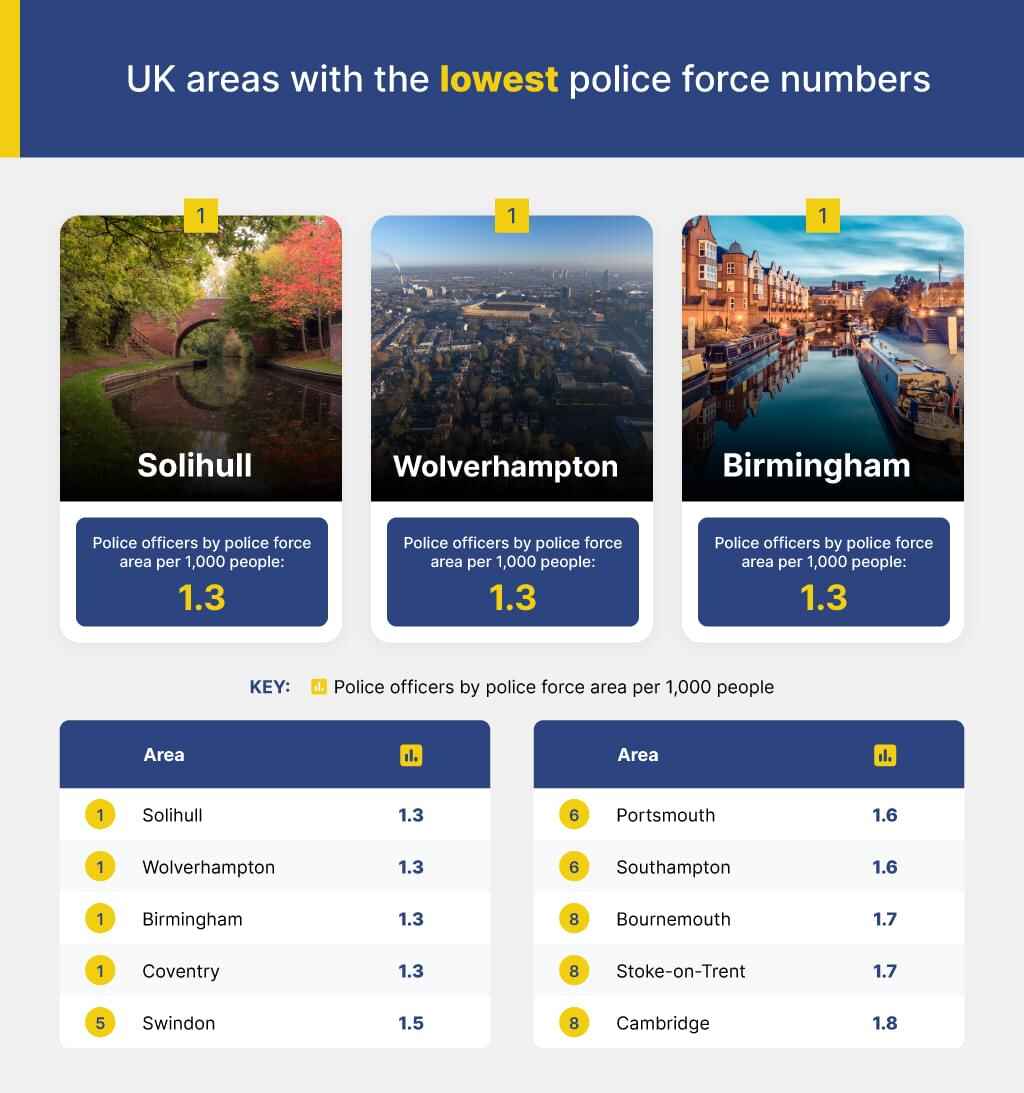
1. Solihull
Police officers per 1,000 people by police force area: 1.3
The area in the UK with the lowest police force numbers is Solihull which is a market town located in the West Midlands of England. There are around 1.3 police force workers per 1,000 of the West Midlands Police area population.
1. Wolverhampton
Police officers per 1,000 people by police force area: 1.3
Wolverhampton, a city in the West Midlands and as such is under the West Midlands Police Force, is among the cities with the lowest police presence in the UK. The city is home to just 1.3 police officers per 1,000 people in the West Midlands Police area.
1. Birmingham
Police officers per 1,000 people by police force area: 1.3
Tied for first place, England’s second city has one of the lowest police officer numbers out of all the areas we looked at. Birmingham’s policing authority, the West Midlands Police, has just 1.3 officers per 1,000 people.
1. Coventry
Police officers per 1,000 people by police force area: 1.3
Tied in first place, Coventry is also served by the West Midlands Police force. As such, there are just 1.3 police officers for every 1,000 people in the area.
UK areas with the least primary fire incidents
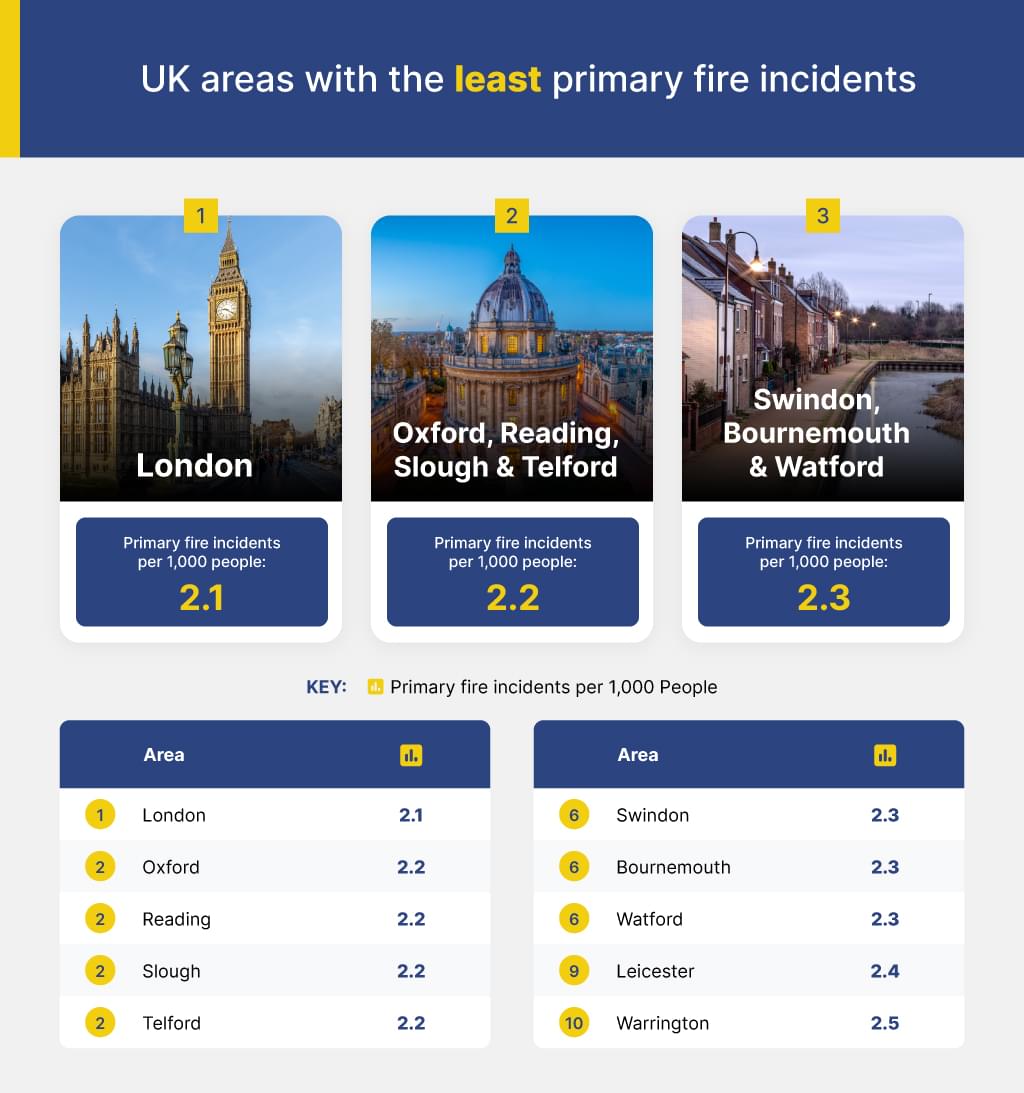
1. London
Primary fire incidents per 1,000 people: 2.1
London, belonging to the Greater London Fire and Rescue Service, has had the fewest fire incidents in the UK. In the last year, there were just 2.1 fire incidents per 1,000 of the fire and rescue service’s population.
2. Oxford
Primary fire incidents per 1,000 people: 2.2
Tied in second place, Oxford is one of the UK areas that experienced the least fires last year. There were just 2.2 primary fire incidents calculated per 1,000 of the Oxfordshire fire and rescue service’s population.
2. Reading
Primary fire incidents per 1,000 people: 2.2
Reading, which is served by the Berkshire Fire and Rescue Service is tied in second place for the least fires in the UK. In the last year, there were just 2.2 primary incidents per 1,000 of the fire and rescue service’s population.
2. Slough
Primary fire incidents per 1,000 people: 2.2
Tied in second place, Slough, which is also served by the Berkshire Fire and Rescue Service, experienced fewer fires in the last year than most other areas we looked at. There were 2.2 primary fire incidents per 1,000 of the fire and rescue service’s population.
2. Telford
Primary fire incidents per 1,000 people: 2.2
Telford, which resides under the Shropshire Fire and Rescue Service, experienced just 2.2 primary fire incidents per 1,000 people in the last year. Therefore, it is tied in second place.
UK areas with the most primary fire incidents
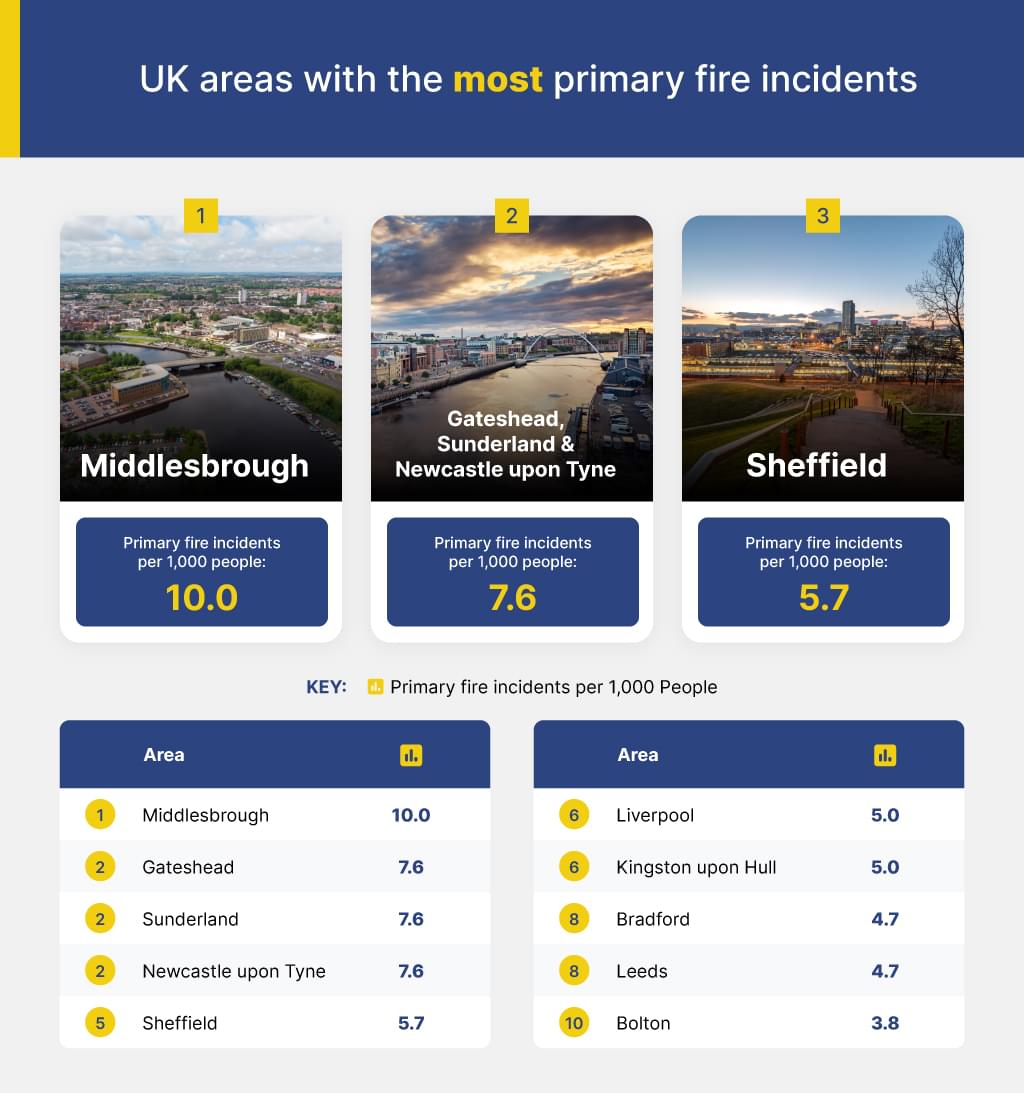
1. Middlesbrough
Primary fire incidents per 1,000 people: 10
Middlesbrough has the highest fire incident rate in the UK. Falling under the Cleveland Fire and Rescue Service, Middlesbrough had 10 such incidents per 1,000 people last year.
2. Gateshead
Primary fire incidents per 1,000 people: 7.6
Under the authority of the Tyne and Wear Fire and Rescue Service, Gateshead is tied for the second-highest fire incident rate. Last year, there were 7.6 incidents per 1,000 of the population.
2. Sunderland
Primary fire incidents per 1,000 people: 7.6
Sunderland is under the jurisdiction of the Tyne and Wear Fire and Rescue Service. And with 7.6 fire incidents per 1,000 people, the city is tied in second place for the highest fire incident rate in the UK.
2. Newcastle upon Tyne
Primary fire incidents per 1,000 people: 7.6
Newcastle upon Tyne, also served by Tyne and Wear Fire and Rescue Service is tied in second place, as one of the UK areas that experience the most primary fires. There were 7.6 primary fire incidents per 1,000 people in the Tyne and Wear Fire and Rescue Service area over the last year.
UK areas with the most CCTV cameras
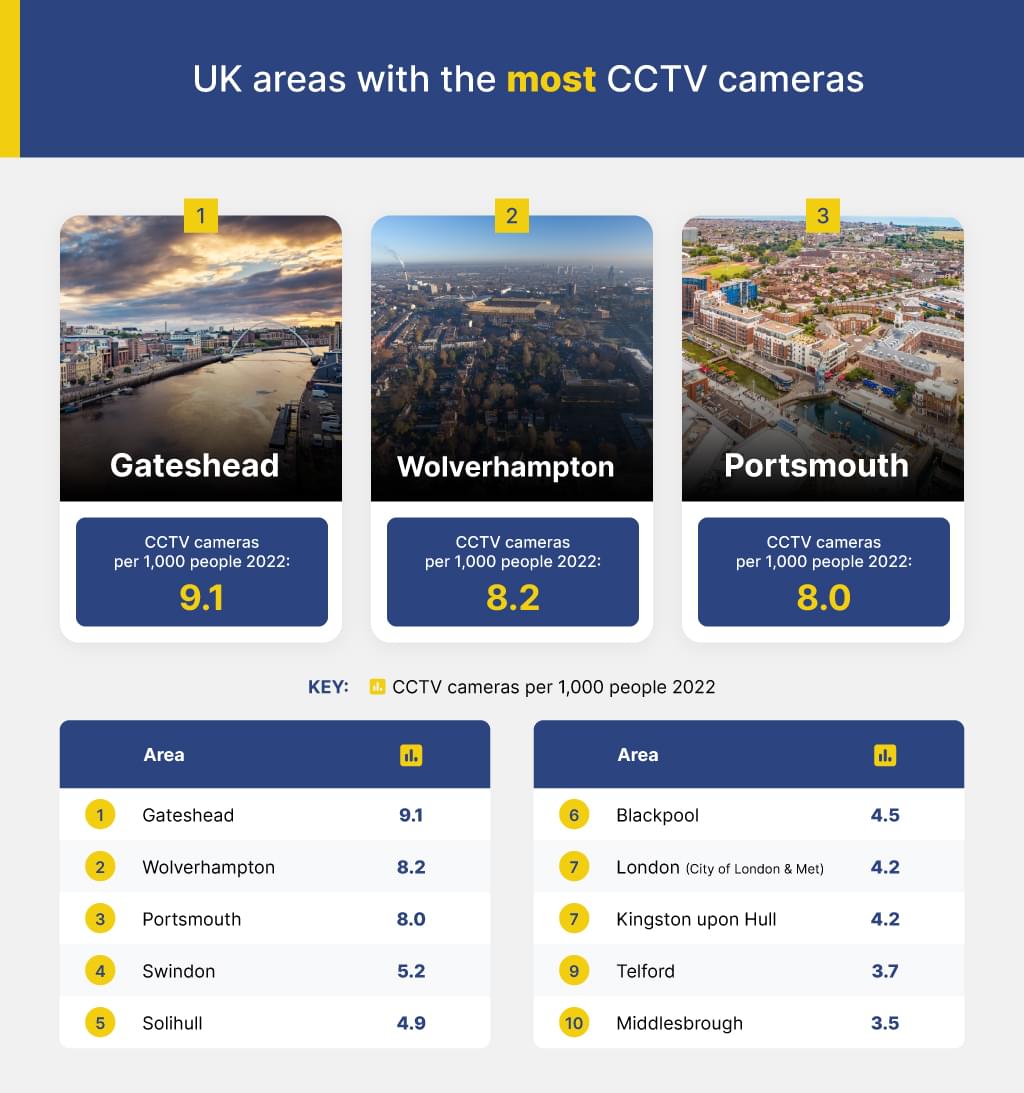
1. Gateshead
CCTV Cameras per 1,000 People 2022: 9.1
Gateshead, which is on the Tyne’s southern bank opposite Newcastle, has the highest number of CCTV cameras in the UK. For every 1,000 people in the town, there are 9.1 CCTV cameras, as such you can be sure no wrongdoing will go unnoticed.
2. Wolverhampton
CCTV Cameras per 1,000 People 2022: 8.2
The Council of Wolverhampton, a city which is located in central England, has the second-highest number of CCTV cameras. For every 1,000 people in the city, there are 8.2 CCTV cameras.
3. Portsmouth
CCTV Cameras per 1,000 People 2022: 8
In Portsmouth, located on England’s southern coast, there are 8 CCTV cameras for every 1,000 people in the city. This means that it has the third highest number of CCTV cameras watching over the safety of the public.
UK areas with the fewest CCTV cameras
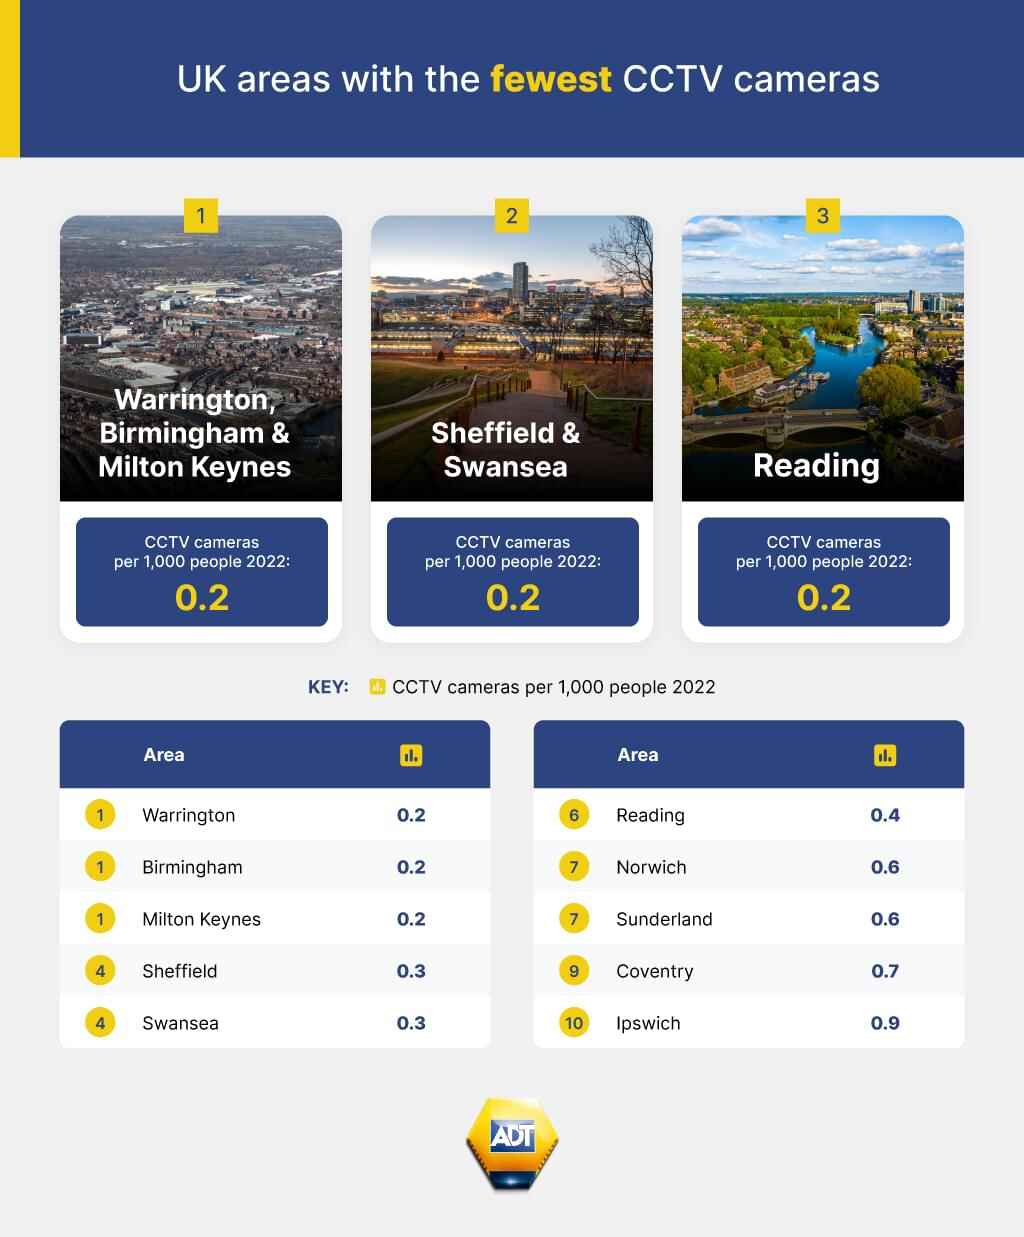
1. Warrington, Birmingham & Milton Keynes
CCTV Cameras per 1,000 People 2022: 0.2
A three-way tie for the area with the fewest number of CCTV cameras, we have Warrington, Birmingham and Milton Keynes. All three of which have just 0.2 CCTV cameras per 1,000 of their respective populations.
2. Sheffield & Swansea
CCTV Cameras per 1,000 People 2022: 0.3
Next, we have another tie, this time between Sheffield and Swansea, with the second-fewest CCTV cameras per 1,000, having just 0.3.
3. Reading
CCTV Cameras per 1,000 People 2022: 0.4
And Reading, a town in Berkshire which is located in the Thames Valley, has the third-fewest CCTV cameras in the UK. As of 2022, the town has 0.4 CCTV cameras per 1,000 people.
Summary
Regardless of the crime rates, and the number of police and CCTV cameras where you live, you should still invest in extra protection, as it can ward off criminals, such as burglars. For instance, the two postcodes with the highest number of ADT customers: HU9 4DG and SW6 3TA are amongst the lowest crime rates for their respective postcode areas. As such, taking the security of your home into your own hands, with security systems such as those that we at ADT offer is sure to better protect your home from being targeted by criminals.
Methodology -
To begin, we took a list of the most populated towns and cities in the UK, using The Geographist. Note: We had to remove Scottish and Northern Irish cities and towns due to a lack of data. Brighton, Colchester and Gloucester were also removed due to a lack of data.
We then used ONS’s Recorded crime data by Community Safety Partnership area to take the total number of crimes and burglaries for each city we looked at for the year ending December 2022. We then used the population figures to calculate the burglary and crime rates per 1,000 of the population.
We then used the UK Government’s Police workforce, England and Wales: 30 September 2022 Table 1 to take the number of police officers for each of the city and town's corresponding police force areas as of September 2022. We then used the population for each police force area, sourced from Crime in England and Wales: Police Force Area data tables mid-2021 population estimate as the most recently available figure to calculate this figure per 1,000 of the population. For London, we combined police force numbers and population figures for the City of London and the Metropolitan Police.
We then used the UK Governments Fire statistics data tables using table 0102 to find the total number of primary fire incidents for the financial year 2022/23. We used the Welsh Governments Fires attended by Fire and Rescue Services in Wales for the year ending December 2022. We then took the number of incidents for the Fire and Safety Service that each city or town belonged to and sourced the population of each Fire and Safety Service area using Gov.uk Resident Population Estimates most recently available figures to calculate this per 1,000 people.
We then used Iron Mongery Direct’s FOI request from 2022 to take down the number of CCTV cameras that each city and town in England and Wales provided. We then calculated this number per 1,000 of each area's population.
Lastly, for the postcode sector data, we used UK Crime Stats to take the total number of crimes and burglaries for each postcode sector, as well as the population of each area. We then calculated the crime and burglary rates per 1,000 people. All postcodes under the Greater Manchester Police Service were removed due to a lack of data. Additionally, all postcodes with a population of under 5,000 were removed, so as to not skew the data.